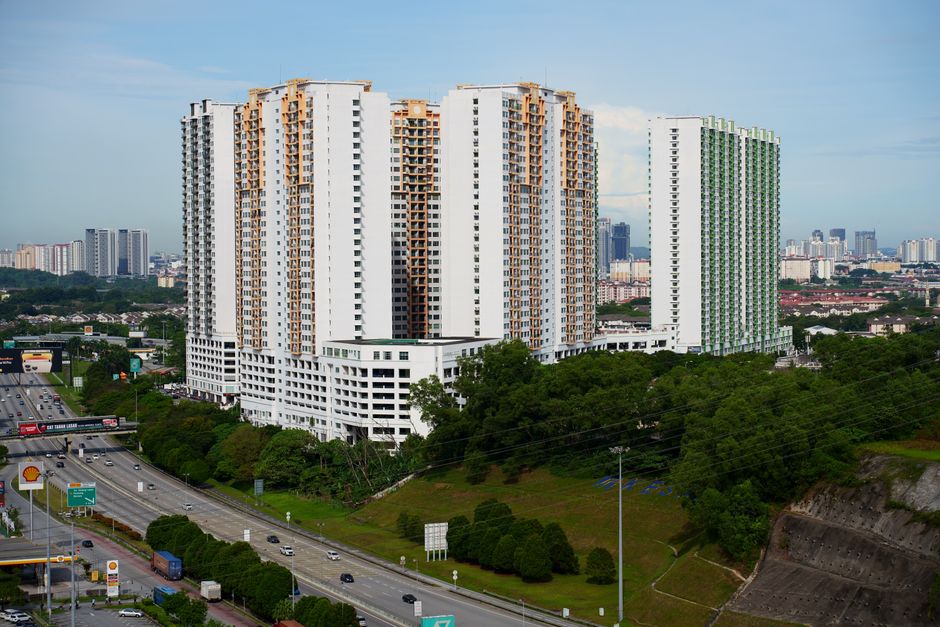


Bengbu Commercial Property Market: Vacancy Rates, Rental Trends, and Investment Shifts in 2025
Bengbu’s commercial property market entered 2025 with a Grade A office vacancy rate of 22.3%, reflecting a 2.1 percentage point increase from 2024 and the highest level in the past five years. The city’s commercial real estate (商业地产, shāngyè dìchǎn) segment, which includes offices, retail space, and industrial properties, is undergoing a structural adjustment driven by new supply absorption challenges and changing tenant demand patterns. Despite this, rental rates have shown unexpected stability in certain sub-sectors, with average prime office rents holding at 42.5 RMB/sqm/month, down only 3.2% year-on-year. For foreign companies evaluating mid-tier Anhui cities as potential market entry points, Bengbu’s commercial property trends offer a proxy for the broader Tier-3 city real estate cycle.
Key Market Metrics: What the Numbers Reveal
The Bengbu commercial property market has recorded 185,000 square meters of new supply entering the market in the past 18 months, concentrated in the **Bengbu CBD (蚌埠中央商务区, Bèngbù zhōngyāng shāngwù qū)** and the **Bengbu High-tech Industrial Development Zone (蚌埠高新技术产业开发区, Bèngbù gāo xīn jìshù chǎnyè kāifā qū)**. Net absorption during the same period reached only 132,000 square meters, creating a net vacancy increase of 53,000 square meters. The overall **vacancy rate (空置率, kōngzhì lǜ)** across all commercial property types stood at 19.4% as of Q1 2025, up from 17.8% a year earlier and 15.3% in 2022.
Two contextual numbers highlight the diverging market dynamics: industrial and logistics properties reported a vacancy rate of just 12.1%, compared to 22.3% for Grade A offices. Rental growth in the industrial segment reached +4.8% year-on-year, while office rents declined 3.2%. This gap has widened steadily since 2023, when the differential was only 2.7 percentage points in vacancy and 1.1 percentage points in rental growth. The **rental index (租金指数, zūjīn zhǐshù)** for prime retail space in high-traffic districts such as Huaishang Road and the Bengbu Baolong Pedestrian Street area dropped 1.5% over the same period, outperforming office but lagging industrial properties.
Transaction volumes for commercial property purchases in Bengbu fell 8.7% in 2024 to approximately 2.4 billion RMB, down from 2.63 billion RMB in 2023, according to data from the Anhui Provincial Bureau of Statistics. However, leasing transaction volume — a better measure of operational demand — increased 3.1%, suggesting that while investor appetite waned, end-user demand held steady. Pre-leasing rates for new office projects scheduled for completion in 2025 stand at 31.5%, compared to a historical average of 42% for projects launched between 2019 and 2022.
Sector-Specific Trends: Offices Under Pressure, Industrial Holds Firm
Grade A Office Market
The office segment in Bengbu is experiencing its softest conditions since 2019. Vacancy in **Grade A office buildings (甲级写字楼, jiǎ jí xiězì lóu)** rose to 22.3% in Q1 2025, driven largely by weak demand from the financial services and real estate development sectors, which together account for 38% of office leasing in the city. Effective rents — after adjusting for rent-free periods and fit-out allowances — have fallen more sharply than headline rents, declining 5.8% year-on-year, as landlords offer incentives to attract tenants. The average lease term for new contracts shortened to 2.8 years from 3.5 years in 2022, signaling reduced tenant commitment. Conversely, demand from technology and professional services firms, particularly those linked to Bengbu’s expanding health-tech sector, increased by 7.2% in floor area leased in 2024.
Retail and Street-Level Commerce
Bengbu’s retail commercial property market presents a mixed picture. Prime retail vacancy rose to 18.7% as of Q1 2025, from 17.1% a year ago, as several mid-sized anchors in traditional department stores closed or downsized. However, leasing activity in the **street-level commerce (沿街商业, yán jiē shāngyè)** segment along Bengbu’s primary pedestrian corridors increased 4.5% year-on-year, driven by food and beverage outlets, experiential retail, and domestic brand expansion. Rental rates for ground-floor shops in the Baolong district held steady at 55 RMB/sqm/month, while second-floor vacancy rose above 30%. Landlords are increasingly willing to offer split-floor leases and shorter terms of 1–2 years to attract smaller tenants.
Industrial and Logistics Property
The standout performer in Bengbu’s commercial property market is the industrial and logistics segment. Vacancy dropped to 12.1%, the lowest among all commercial property types, supported by demand from e-commerce fulfillment centers and manufacturing firms relocating from higher-cost coastal provinces. Lease rates for standard warehouses rose to 22 RMB/sqm/month, a 4.8% year-on-year increase, marking the third consecutive year of above-inflation growth. The Bengbu Comprehensive Bonded Zone (蚌埠综合保税区, Bèngbù zōnghé bǎoshuì qū) has been a major demand driver, with tenants including cross-border logistics firms and electronics component manufacturers. The segment now accounts for 34% of all commercial property leasing activity in Bengbu, up from 26% in 2022.
Government Initiatives and Infrastructure Impact
Bengbu’s local government has introduced several policies to stimulate commercial property demand. In late 2024, the **Bengbu Municipal Housing and Urban-Rural Development Bureau (蚌埠市住房和城乡建设局, Bèngbù shì zhùfáng hé chéngxiāng jiànshè jú)** launched a pilot program offering rental subsidies of up to 15 RMB/sqm/month for qualifying technology and services companies leasing Grade A office space in designated districts. The program, initially funded at 30 million RMB, is projected to cover an estimated 200,000 square meters of office space over two years. Early data from Q1 2025 shows 17 companies enrolled, leasing a combined 18,500 square meters.
Infrastructure improvements are also shaping market dynamics. The completion of the Bengbu South High-Speed Rail Station expansion in 2024, which increased passenger capacity by 40%, has improved accessibility to the high-tech zone and surrounding commercial corridors. The city’s new **Metro Line 1 (蚌埠地铁1号线, Bèngbù dìtiě yī hào xiàn)**, currently under construction and slated for completion in late 2026, is expected to connect the CBD with the high-tech zone and the Bengbu Railway Station, potentially raising foot traffic and lease values along its route by an estimated 10–15%. Developers are already pre-leasing commercial space near planned station exits, with average pre-leasing rates of 45% reported for projects within 500 meters of station sites.
Meanwhile, the Bengbu government has tightened control on new commercial property development approvals. In 2024, approvals for new commercial projects fell to 280,000 square meters, down 32% from 2023’s 412,000 square meters — the lowest level since 2018. This supply-side restraint is expected to gradually improve vacancy conditions, particularly for offices, beginning in 2026, provided demand does not weaken further. For context, the city’s population growth rate was 0.4% in 2024, and GDP grew 5.1%, supporting a baseline of commercial demand but insufficient to absorb the current overhang quickly.
Comparative Market Data Table
| Sub-Sector | Vacancy Rate Q1 2025 | Vacancy Rate Q1 2024 | Avg. Rental (RMB/sqm/mo) | Rental Change YoY | New Supply 2024–25 (sqm) |
|---|---|---|---|---|---|
| Grade A Office | 22.3% | 20.2% | 42.5 | -3.2% | 85,000 |
| Grade B Office | 25.8% | 23.9% | 28.0 | -4.1% | 45,000 |
| Prime Retail (CBD) | 18.7% | 17.1% | 55.0 | -1.5% | 42,000 |
| Street-Level Retail (High-traffic) | 15.4% | 14.2% | 48.0 | -2.0% | 28,000 |
| Industrial/Logistics | 12.1% | 13.5% | 22.0 | +4.8% | 120,000 |
| Bonded Zone Warehousing | 8.3% | 9.7% | 26.5 | +6.2% | 65,000 |
Source: Anhui Provincial Bureau of Statistics, Bengbu Municipal Housing and Urban-Rural Development Bureau, Anhui Gateway market research. Notes: Rental rates are average effective rents for leases signed in each sub-sector. New supply figures represent total completions in 2024 plus forecast completions for H1 2025.
Outlook and Strategic Considerations for Foreign Investors
The Bengbu commercial property market is exhibiting a clear bifurcation: industrial and logistics assets are benefitting from structural drivers such as supply chain relocation and e-commerce growth, while office and retail face headwinds from oversupply and shifting tenant preferences. For foreign companies evaluating Bengbu for a new presence, the relative cost advantage compared to Tier-1 cities remains compelling — office rents in Bengbu are approximately 65% lower than in Nanjing and 80% lower than in Shanghai. However, the high vacancy and weakening rental trends suggest tenants hold the negotiating advantage in office and retail segments, while industrial tenants are facing tighter supply and rising rents.
Looking ahead, the reduction in new commercial development approvals is a positive sign for the market’s medium-term recovery. The 32% drop in approvals in 2024 should begin to slow the pace of vacancy increases by 2026–2027. For investors, the window of favorable leasing terms in the office segment may narrow as supply discipline takes effect. The performance of the High-tech Zone and the bonded zone will be critical watchpoints, as these areas are generating the bulk of net absorption and could set the benchmark for the wider market’s recovery trajectory. For now, Bengbu’s commercial property market presents divergent opportunities, with logistics and bonded zone assets at the top of the risk-adjusted return spectrum.
NEXT STEPS
If you are evaluating Bengbu for commercial property leasing, acquisition, or market entry, here are three practical actions to take now:
- Assess sector-specific fit. Review our Anhui market entry guide for Bengbu to understand which commercial property sub-sectors align with your industry profile and operational requirements. Read the full guide →
- Compare with nearby Tier-3 cities. Bengbu is not the only option in the Huai River corridor. Our comparison of Bengbu vs. Hefei vs. Wuhu commercial property markets can help you benchmark rents, vacancy, and incentives. View the comparison →
- Get on-the-ground data updates. We track monthly leasing and transaction data for Bengbu’s commercial property sub-sectors. Subscribe to our Anhui real estate brief to receive the latest vacancy and rental figures. Subscribe now →
— Anhui Gateway —
Remote China market entry support, built around execution.